Pesticide Risk & Respiratory Health Modeling
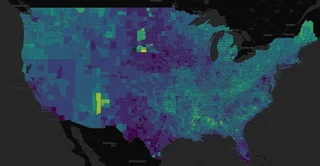 County-level asthma and COPD risk map from the live product.
As part of a Spring 2026 team project, I worked on a county-level modeling pipeline that linked pesticide exposure estimates to respiratory health burden in the United States. The goal was to build a planning-oriented model that could help public health stakeholders identify where asthma and COPD burden may warrant closer attention—while explicitly accounting for the ethical and equity implications of doing so.
Highlights
- Built county-level XGBoost models to estimate relative asthma/COPD burden tied to pesticide-related context.
- Published an interactive map for planning and resource prioritization, not diagnosis.
- Paired performance metrics with equity/error analysis to make limits and risks explicit.
Problem
Agricultural pesticide use varies substantially by crop and region, and exposure risk is not evenly distributed. These differences often intersect with existing structural inequities in environmental exposure and healthcare access.
Public health agencies, health systems, and insurers need tools to prioritize prevention and outreach, especially when resources are limited. However, tools that surface “high-risk” areas can unintentionally reinforce stigma or obscure underlying structural drivers if not carefully designed and interpreted.
This project asked a practical question: can we combine public exposure, land-use, and health data to flag counties where pesticide-related respiratory burden may be higher—while maintaining transparency about uncertainty and equity impacts?
Approach
We built a county-year modeling pipeline for 2018 and 2019 that joined pesticide use estimates with respiratory-health outcomes and county context. The final product included both a documented modeling workflow and a public-facing GitHub Pages site with an interactive county risk map.
From the outset, the work was framed as a population-level planning tool, not a diagnostic or causal system. We paired model development with a “justification-for-proceeding” framework to surface assumptions, risks, and potential downstream harms before they became embedded in the system.
This included:
- defining appropriate use (resource prioritization, not individual prediction)
- identifying potential misuse (e.g., stigmatizing communities or over-attributing causality)
- evaluating how model errors might differentially impact populations
Methods
The modeling dataset combined:
- CDC PLACES county-level indicators, including asthma, COPD, smoking, obesity, and diabetes
- USGS / EPA pesticide use estimates
- USDA Cropland Data Layer features
- ACS demographic covariates
The final selected model was an XGBoost regressor using a feature set that included 445 pesticide mass features plus baseline demographic, health, cropland, and time covariates.
In addition to standard modeling steps (exploratory analysis, spatial train/test splitting, hypothesis testing, and holdout validation), we conducted equity-focused evaluation:
- compared model error across demographic and geographic subgroups
- examined whether prediction accuracy varied systematically in counties with different socioeconomic or population characteristics
- assessed where data sparsity or measurement limitations could bias results
The project also included model-card style documentation to make assumptions, limitations, and intended use explicit.
Outcome / Impact
The final XGBoost models performed strongly on held-out county-level validation data:
- Asthma (CASTHMA): R² = 0.835, RMSE = 0.389, n = 1219
- COPD: R² = 0.885, RMSE = 0.765, n = 1219
The project also produced a live interactive map that translates model output into a more usable planning interface for non-technical stakeholders.
Importantly, the equity analysis surfaced a meaningful gap:
- model performance was not uniform across counties, with higher error observed in some regions with different demographic compositions and data coverage
- this suggests that the areas most affected by environmental and health inequities may also be those where predictions are less reliable
This finding shaped how we positioned the tool:
- as a starting point for investigation, not a definitive ranking
- as a way to guide additional data collection and local validation, especially in underrepresented areas
More broadly, the project reinforced that building useful models in public health requires more than predictive performance. It requires clear communication about:
- what the model can and cannot say
- where it may fail
- and how its outputs could impact real communities if used uncritically
Tools
Python, Jupyter, XGBoost, county-level public health data, geospatial joins, GitHub Pages, model-card documentation, responsible AI frameworks.
I’m a data scientist with a PhD in social psychology. My work sits at the intersection of behavioral science, experimentation, and applied analytics, with experience spanning digital health, education research, and product-focused data work.
I’m especially interested in problems where careful measurement changes real decisions: designing experiments, working with longitudinal and behavioral data, building predictive models, and translating technical results into something a product, research, or leadership team can actually use.
Alongside my analytic work, I maintain a studio art practice in encaustic, cold wax, and watercolor.